The lesson
Turn a data report into an interactive benchmark by letting readers filter first, then compare each metric through the same chart and percentile-table pattern.
The move
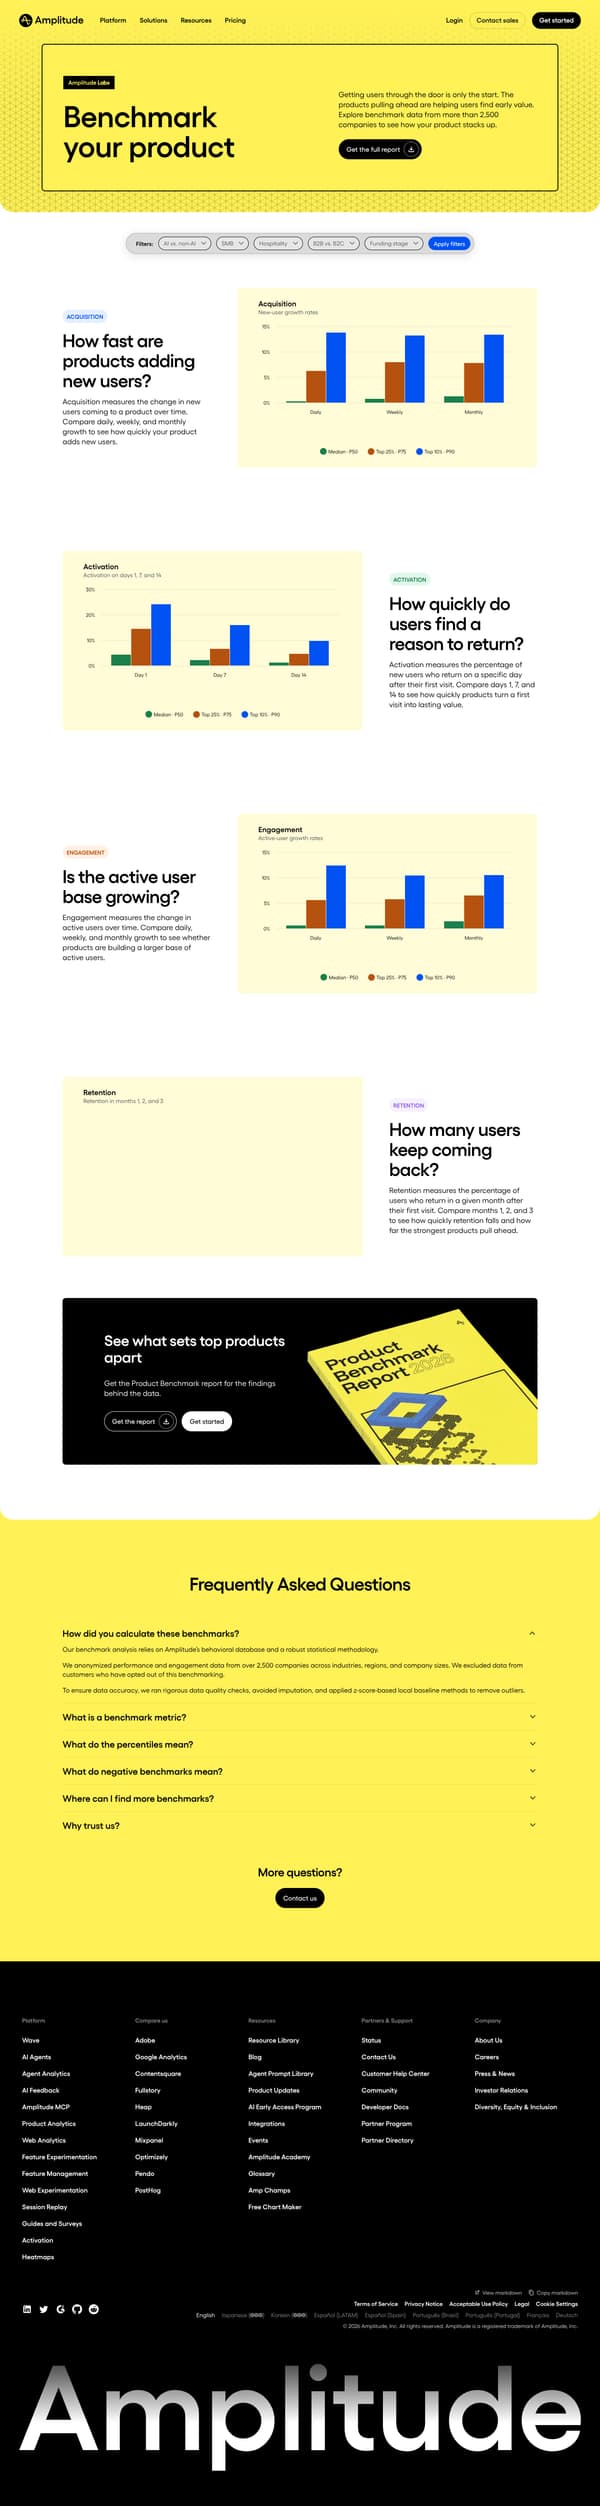
A yellow Amplitude Labs hero introduces “Benchmark your product” with the line “Getting users through the door is only the start” and a “Get the full report” button. A filter bar follows for AI vs. non-AI, company size, industry, B2B vs. B2C and funding stage, with an “Apply filters” action. The body runs through “ACQUISITION,” “ACTIVATION,” “ENGAGEMENT” and “RETENTION,” each framed as a question, followed by a short metric definition, a chart and a percentile table. The page closes with “See what sets top products apart,” a report CTA and a FAQ explaining methodology, percentiles, negative benchmarks and why to trust Amplitude.
Why it works
- Our readThe filter bar lets a reader narrow the benchmark before reading, so the charts feel specific to a company size and industry.
- Our readEach metric section starts with a plain question, which turns a technical metric into something a product team can judge.
- Our readCharts are paired with percentile tables, so readers can skim the visual pattern or copy the exact benchmark values.
What not to copy
Don't copy Amplitude's product categories, benchmark dataset or yellow visual system. Keep the structure of filters, metric questions, chart, table and methodology FAQ.
More from Amplitude





More content marketing








Steal it for your brand.
Tell us what you want to make. We’ll talk through how to put these ideas to work for your brand.