The lesson
Put the whole argument in a boxed summary and one opening chart, then spend the remaining words on what changes for the reader.
The move
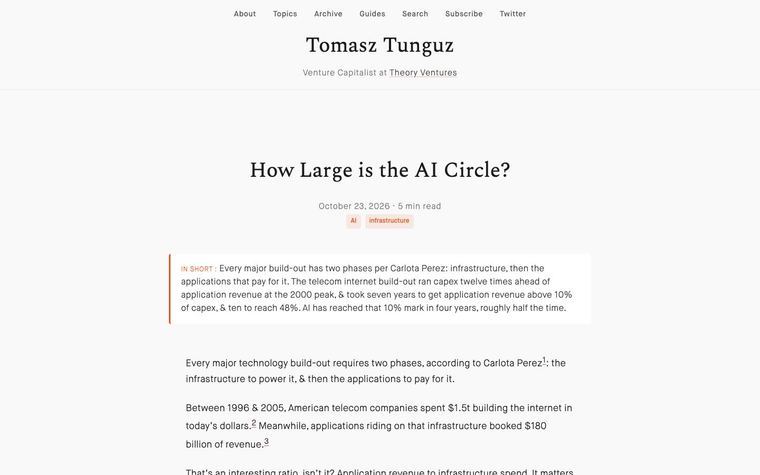
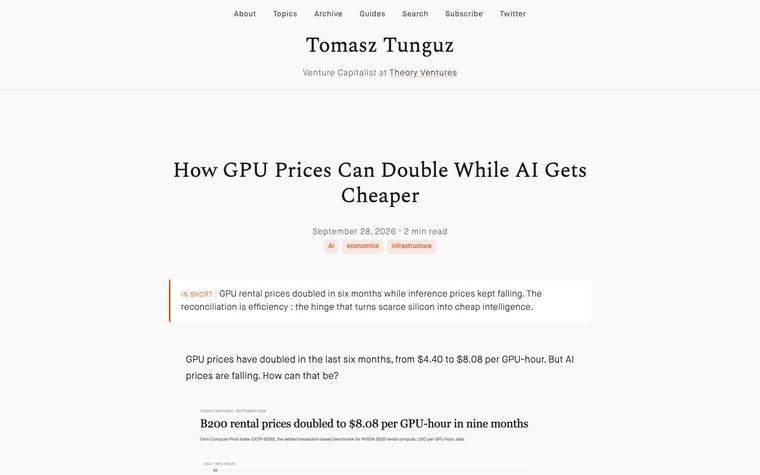
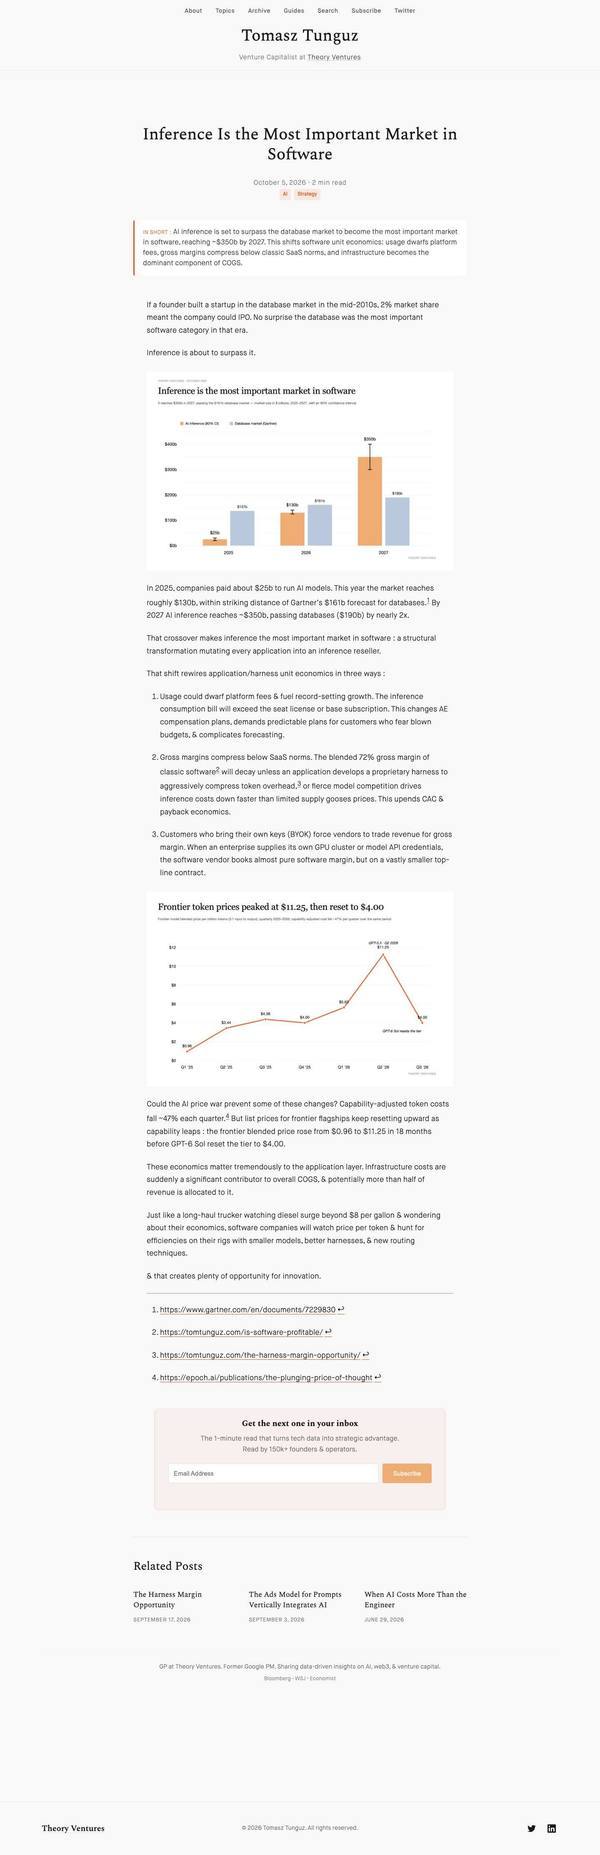
An "IN SHORT" box under the title says inference passes databases at about $350b by 2027. A bar chart titled "Inference is the most important market in software" compares 2025, 2026 and 2027. A numbered list gives three effects on application economics, then a second chart, "Frontier token prices peaked at $11.25, then reset to $4.00".
Why it works
- Our readThe summary box and the chart title both state the claim, so a skimmer gets it without reading the text.
- Our readOpening with the database market as a comparison gives the reader a familiar benchmark for the size.
- Our readNumbered consequences turn the market claim into things a software operator can act on, such as pricing and margin.
What not to copy
Don't reuse these figures. Keep a claim-titled chart, a summary box set off from the text, and a numbered list of consequences, using only data you can cite.