The lesson
Support a market claim with your own charts and footnotes that show the arithmetic, including where the data is weak.
The move
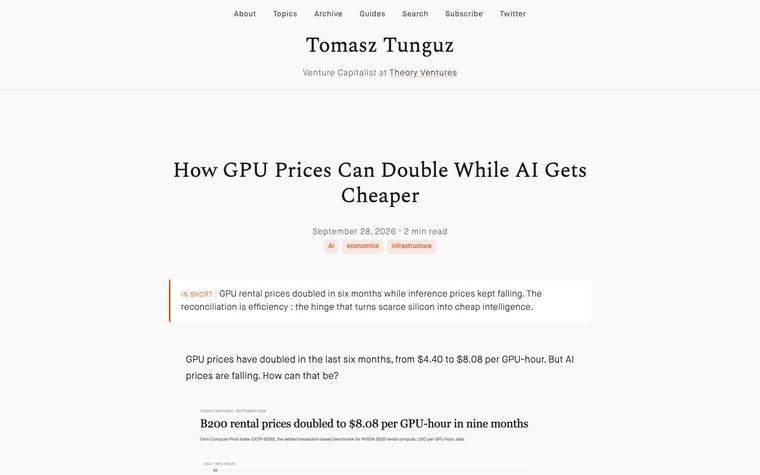
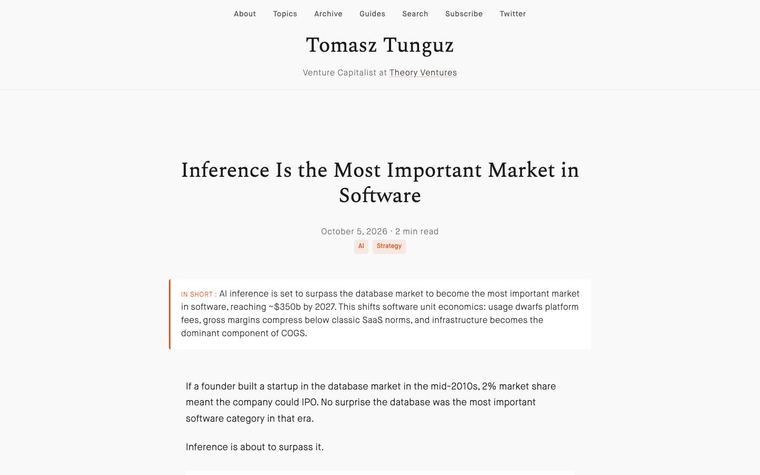
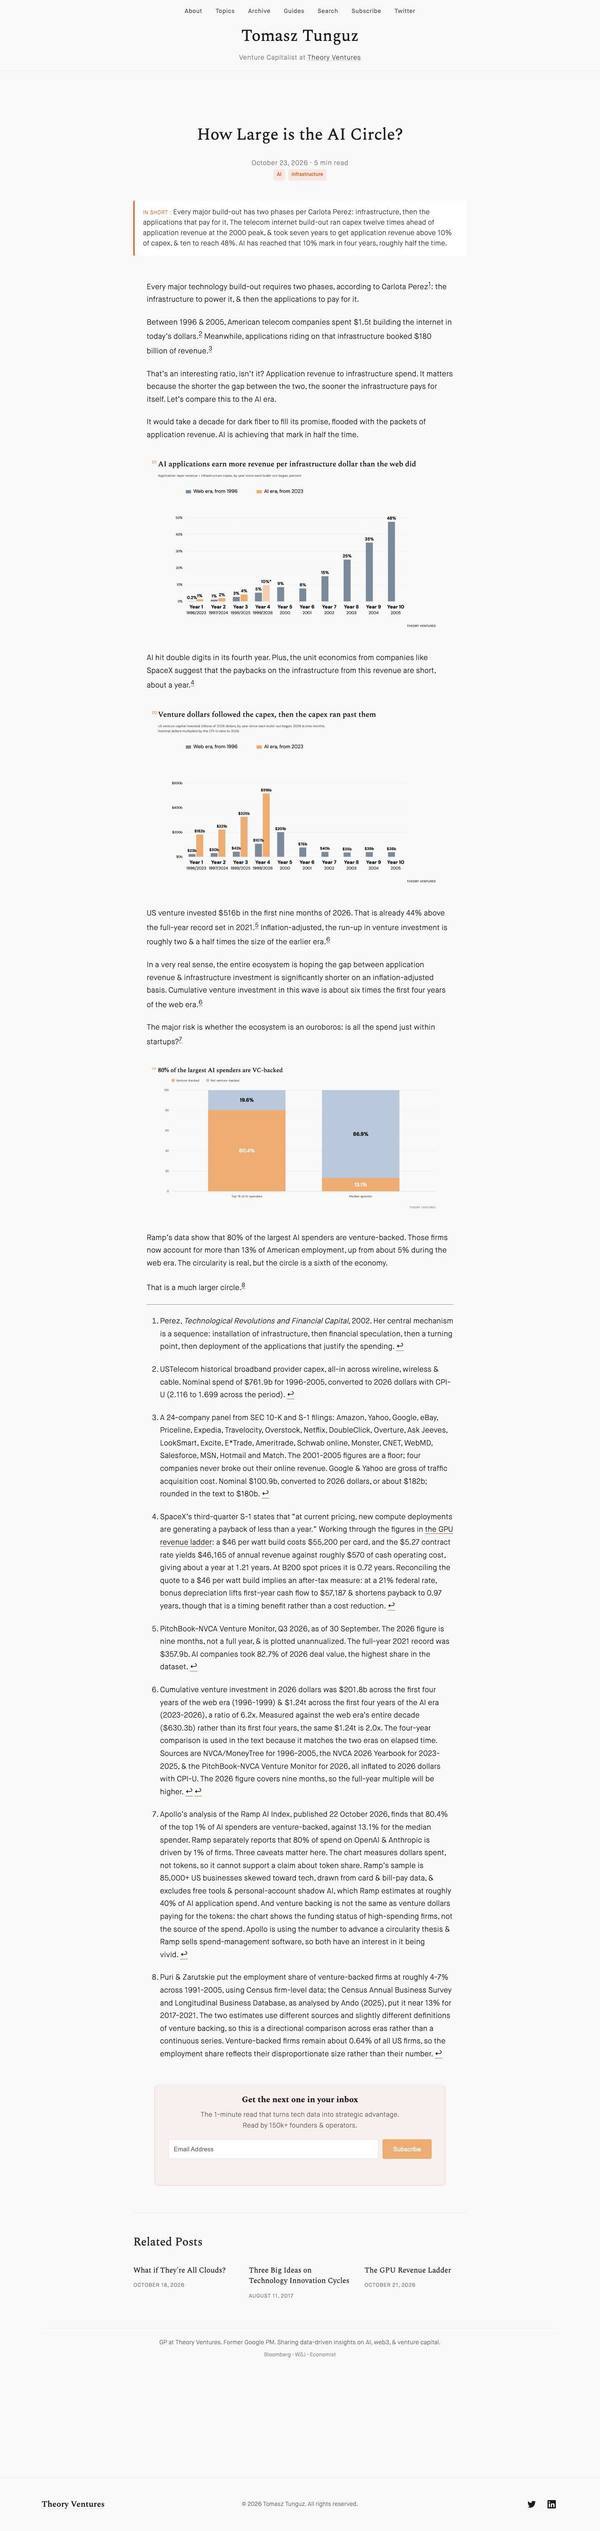
The title "How Large is the AI Circle?" opens with an "IN SHORT" box. Three bar charts follow: "AI applications earn more revenue per infrastructure dollar than the web did", "Venture dollars followed the capex, then the capex ran past them", and "80% of the largest AI spenders are VC-backed". Eight numbered footnotes explain sources and caveats.
Why it works
- Our readAn opening summary box lets a reader take the argument in seconds before deciding to read the charts.
- Our readFootnote 7 lists three caveats on the Ramp data, which signals the author is checking his own claim.
What not to copy
Don't copy the footnote length without the data to back it. Keep chart titles that state the finding as a sentence.