The lesson
Open a case study with the cast and four result numbers, then explain the campaign below for readers who keep going.
The move
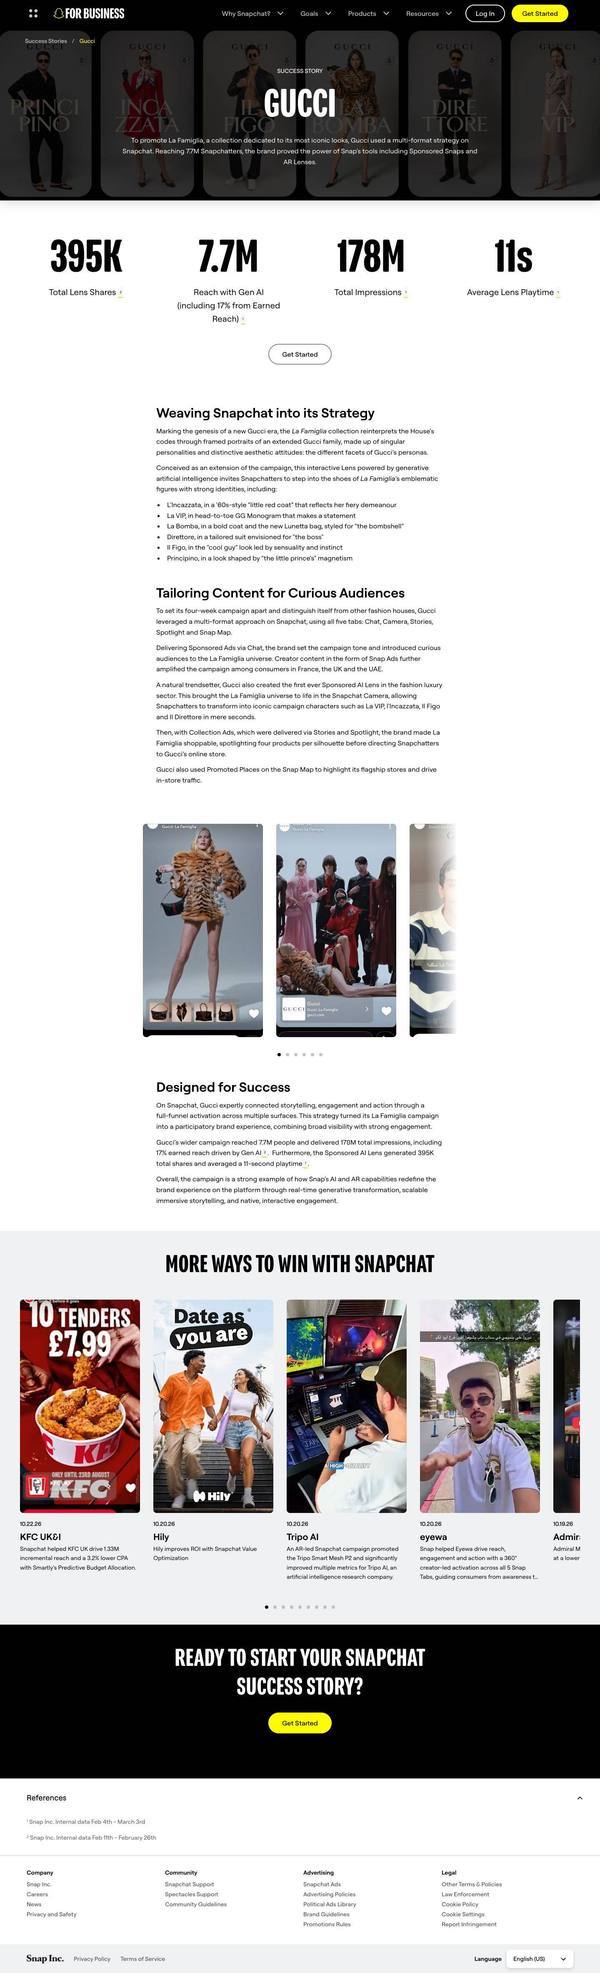
A strip of campaign character portraits runs across the top with "GUCCI" over it. Directly beneath are four big stats: 395K Total Lens Shares, 7.7M Reach with Gen AI (including 17% from Earned Reach), 178M Total Impressions and 11s Average Lens Playtime. Sections of text and a carousel of campaign phone screens follow, then a "READY TO START YOUR SNAPCHAT SUCCESS STORY?" banner.
Why it works
- Our readFour numbers with short labels let a skimmer get the whole outcome before the first text section.
- Our readMixing a reach figure with a playtime figure shows both scale and attention in one row.
- Our readThe phone screens sit well after the stats, so the creative is shown once the numbers are already on the page.
What not to copy
Don't copy the fashion cast or the lens-specific metrics. Keep the stats row directly under the hero and a footnoted source for the numbers.