The lesson
Publish one chart, one finding and a few short paragraphs, and make the chart embeddable so others carry your data.
The move
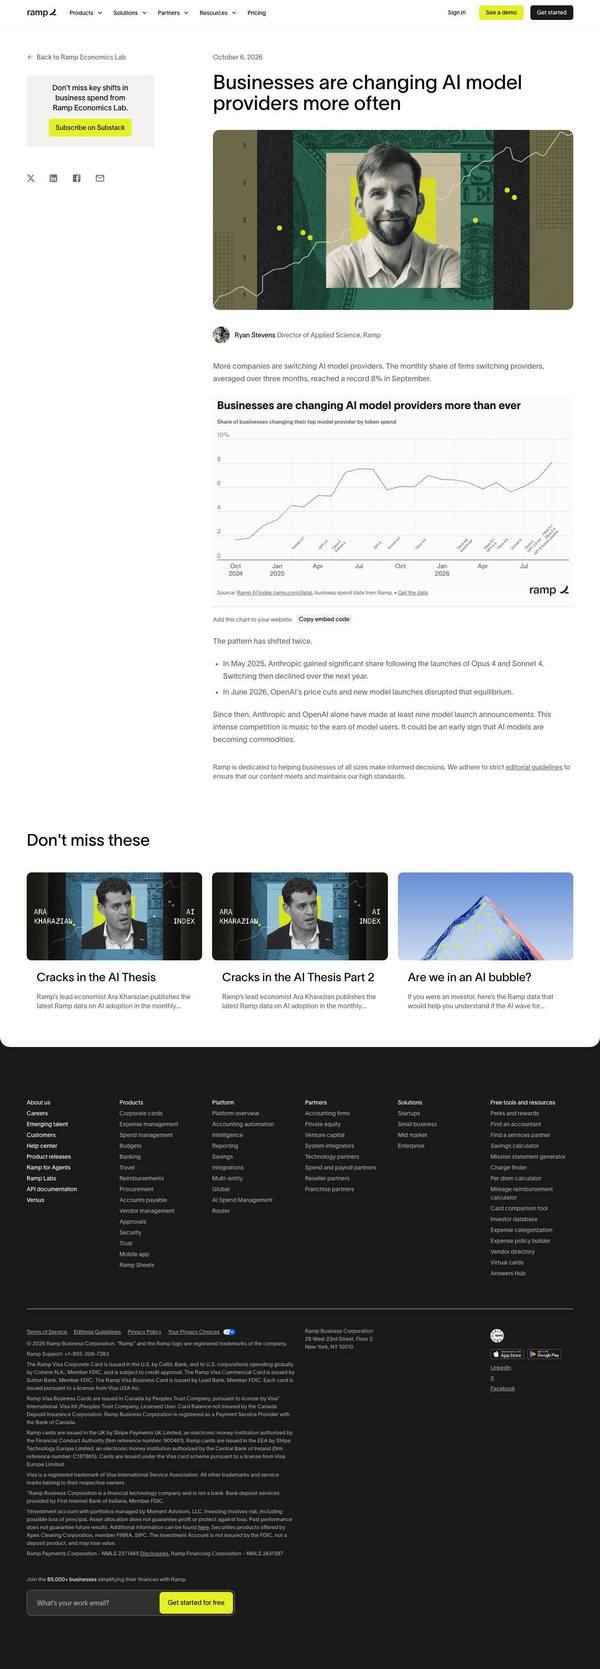
The page titled 'Businesses are changing AI model providers more often' has a hero portrait over a dollar-bill background, then one line chart titled 'Businesses are changing AI model providers more than ever' with a y axis up to 10%. Two bullets date shifts to May 2025 (Anthropic) and June 2026 (OpenAI price cuts). Under the chart sit 'Add this chart to your website' and a 'Copy embed code' button.
Why it works
- Our readThe takeaway, that models may be becoming commodities, is a claim others can quote, and it rests on Ramp's own business spend data.
- Our readA copy-embed button invites other sites to carry the chart, which turns the post into a distribution tool.
- Our readShort length with one visual makes the piece easy to read in a minute.
What not to copy
Don't copy the AI subject; pick a trend visible in your own records. Keep one dated chart, a two-bullet explanation and a plain source line under the graph.