The lesson
Publish a chart from your own customer data, with a finding as the headline, a methodology note, and an embed code next to it.
The move
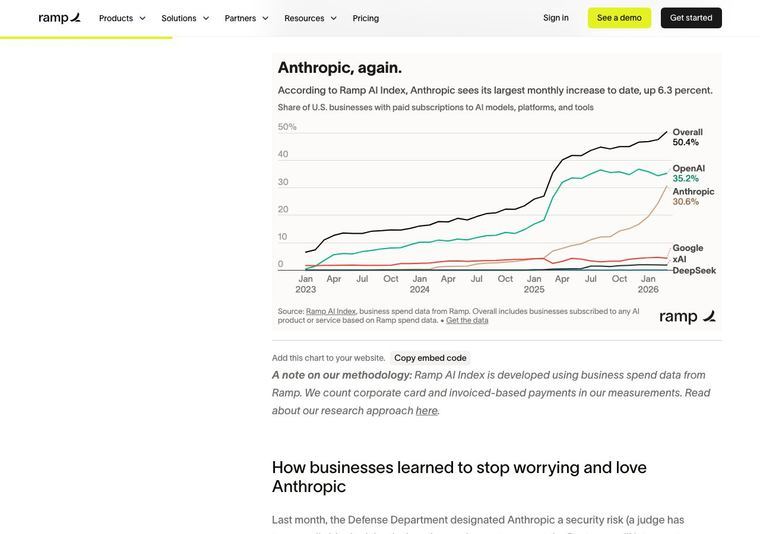
The chart is headed "Anthropic, again." with a subhead on its largest monthly increase, up 6.3 percent. Lines are labeled at their ends: Overall 50.4%, OpenAI 35.2%, Anthropic 30.6%, with Google, xAI and DeepSeek grouped near zero. A source line sits below, then "Copy embed code" and "A note on our methodology".
Why it works
- Our readEnd labels on the lines replace a legend, so a reader gets the current number for each series without looking away.
- Our readPutting the embed code and methodology note directly under the chart invites others to republish it and tells skeptics how the data was built.
What not to copy
The figures are Ramp's and depend on its own spend data. Keep the three-part package of finding headline, labeled lines and method note, using data only you hold.