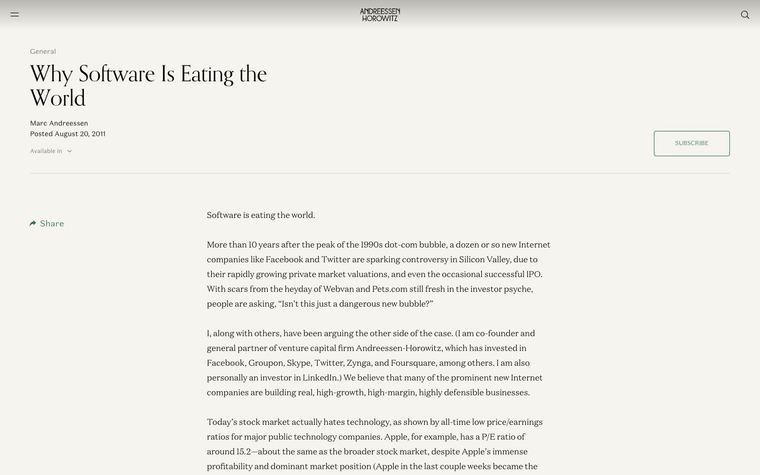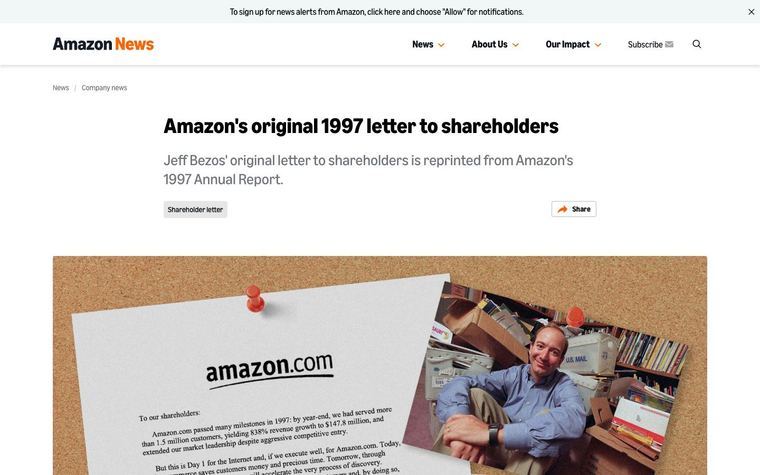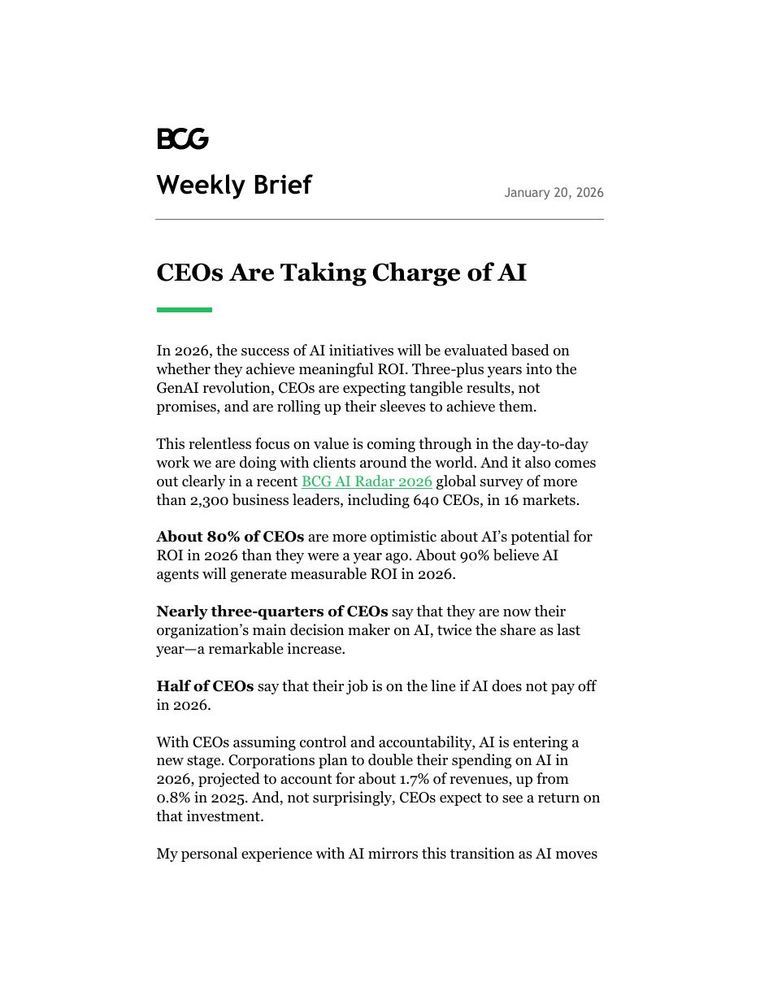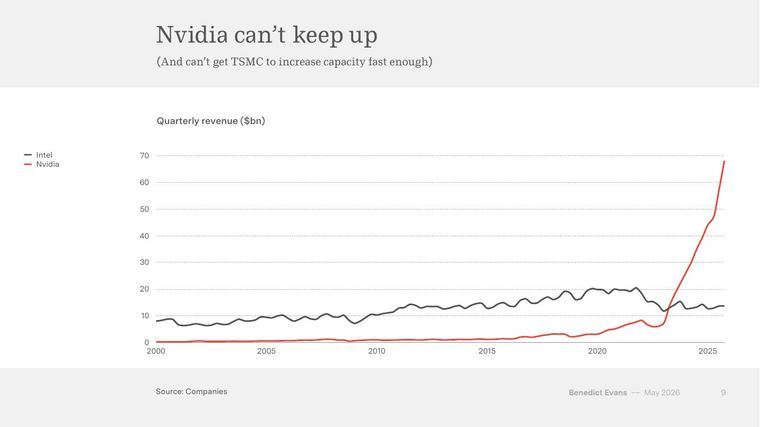
The lesson
Title the piece with the sceptic's question, then make the chart headline the answer, so the reader gets the verdict at a glance.
The move
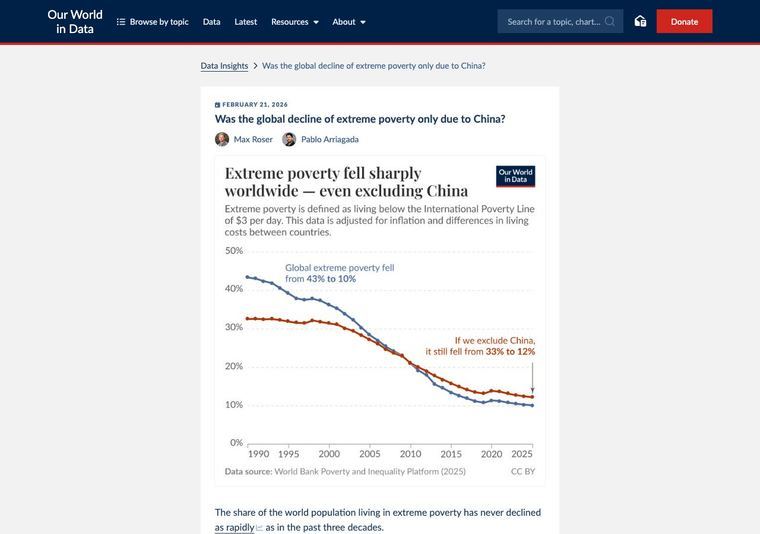
The page title is "Was the global decline of extreme poverty only due to China?" and the chart headline answers it, opening "Extreme poverty fell sharply worldwide" and adding that this holds even excluding China. Two lines are labelled directly on the chart: "Global extreme poverty fell from 43% to 10%" and "If we exclude China, it still fell from 33% to 12%". A data source line sits under the chart.
Why it works
- Our readThe question is one the reader probably already has, and the chart headline answers it before they scroll.
- Our readLabelling each line with its start and end numbers means no legend or gridline reading is needed.
- Our readThe definition of extreme poverty sits directly under the chart headline, so a newcomer can follow the numbers without leaving the chart.
What not to copy
Don't copy the topic or the two-line comparison unless you have a real counter-case to test. Keep the question-as-title, answer-as-headline pairing and the direct labels.