The lesson
Put your finding in the headline as a ranking against a fixed benchmark, then colour only the data points that prove it.
The move
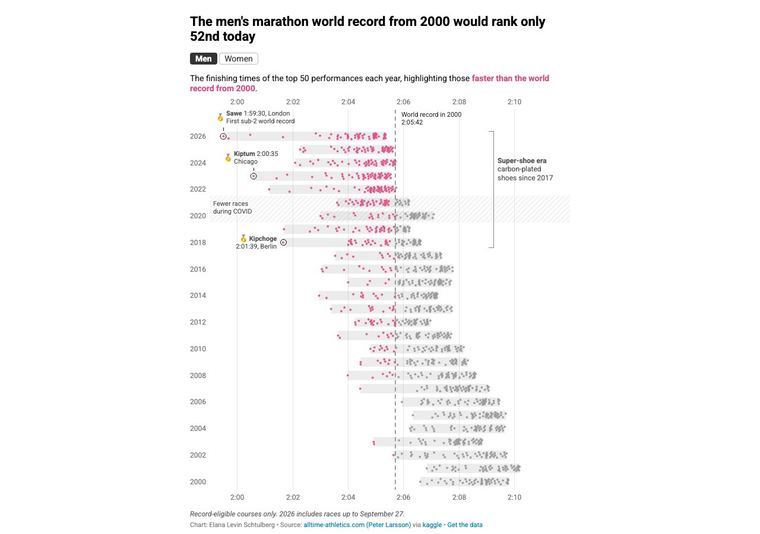
The headline reads "The men's marathon world record from 2000 would rank only 52nd today". In the strip plot, runs faster than the 2000 record (a dashed line at 2:05:42) are pink and everything else is grey. Annotations name Sawe 1:59:30, Kiptum 2:00:35 and Kipchoge 2:01:39, and a bracket marks the "Super-shoe era".
Why it works
- Our readThe dashed 2000 record line splits the chart into pink and grey, so the claim in the headline is visible before any axis is read.
- Our readThree named record runs and a labelled "Fewer races during COVID" band explain the chart's oddities where the eye lands on them, not in a footnote.
- Our readThe line under the chart, "Record-eligible courses only. 2026 includes races up to September 27.", plus a source credit and a "Get the data" link, signals the number can be checked.
What not to copy
Don't copy the sport or the shoe story. Keep the pattern: one comparison number in the headline, one highlight colour, and the caveat and source printed directly under the chart.