
The lesson
Build a benchmark report around one timely comparison, then let readers switch views by channel, time period, region and industry.
The move
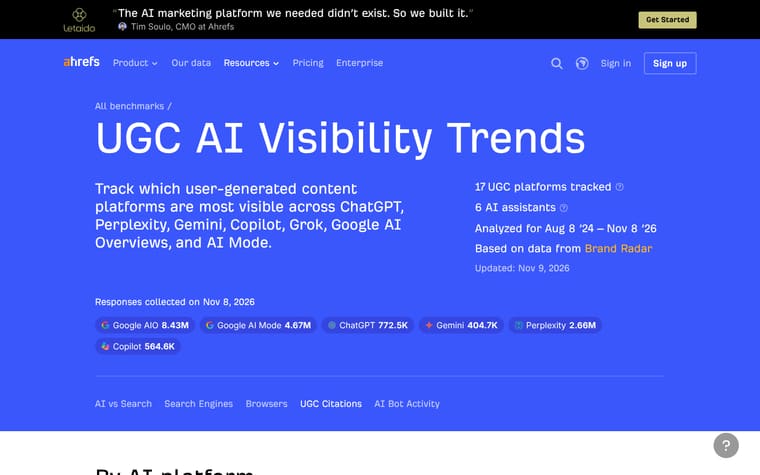
A blue header introduces "AI vs Search Traffic Analysis" with the promise, "How much traffic ChatGPT and other AI platforms send to websites compared with Google and other search engines." It states the sample and source, then opens with tabs such as "AI vs Search", "Search Engines", "Browsers", "UGC Citations" and "AI Bot Activity". The body moves through chart sections including "Absolute traffic trend", "Absolute traffic by channel", "All traffic sources comparison", "Traffic share by category", "Traffic mix by site volume", "Traffic share within different regions" and "Traffic share across different industries". Product calls to action appear between charts, including "See your website’s traffic sources, conversions, and key actions for free with Ahrefs" and "Monitor your traffic share with free Ahrefs Web Analytics".
Why it works
- Our readThe opening comparison is plain, so a reader immediately knows the report is about AI platforms versus search engines as traffic sources.
- Our readThe repeated chart sections let a reader choose the view they care about, from total trend to region to industry.
- Our readThe product prompts are placed next to relevant analytics sections, so the call to action follows the thing the reader is already studying.
What not to copy
Don't copy Ahrefs' traffic data, source categories or benchmark interface. Keep the structure of one timely comparison, a clear data source note, interactive chart sections and contextual product prompts.
More from Ahrefs
More content marketing








Steal it for your brand.
Tell us what you want to make. We’ll talk through how to put these ideas to work for your brand.