All ad campaigns
Ad campaigns

ChartMogul ads

3 campaigns on Google and LinkedIn, read Nov 2026.

LinkedIn ads

LinkedIn 10 ads Oct 2025 – Jul 2026
ChartMogul image ad

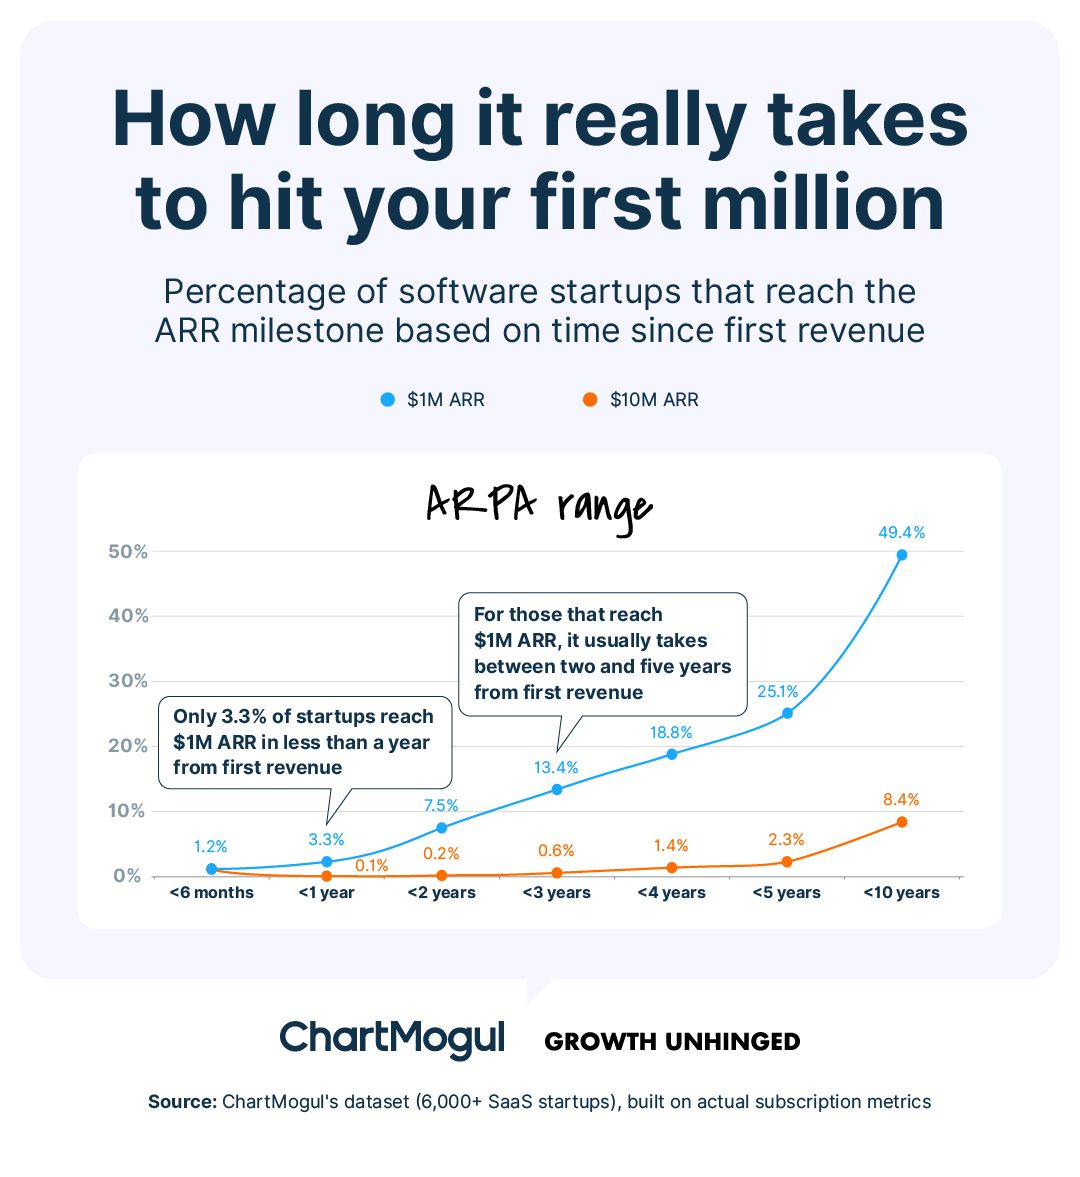
New data from 6,525 SaaS startups: Only 3.3% reach $1 million ARR in less than a year from first revenue. And just 1-in-1,000 reach $10 million in less than a year 🤯 When you listen to VCs, you get the impression that revenue growth happens at warp speed. I partnered with ChartMogul as their Analyst-in-Residence, which means I get to dig into their 🔥 dataset on subscription metrics going back 10+ years & share it with you. What I found: For startups that reach $1 million ARR, it usually takes between two and five years from initial monetization. 1️⃣ A mere 3.3% of startups reach $1 million i
LinkedIn image · Oct 2025 – Mar 2026 Library ↗
ChartMogul image ad

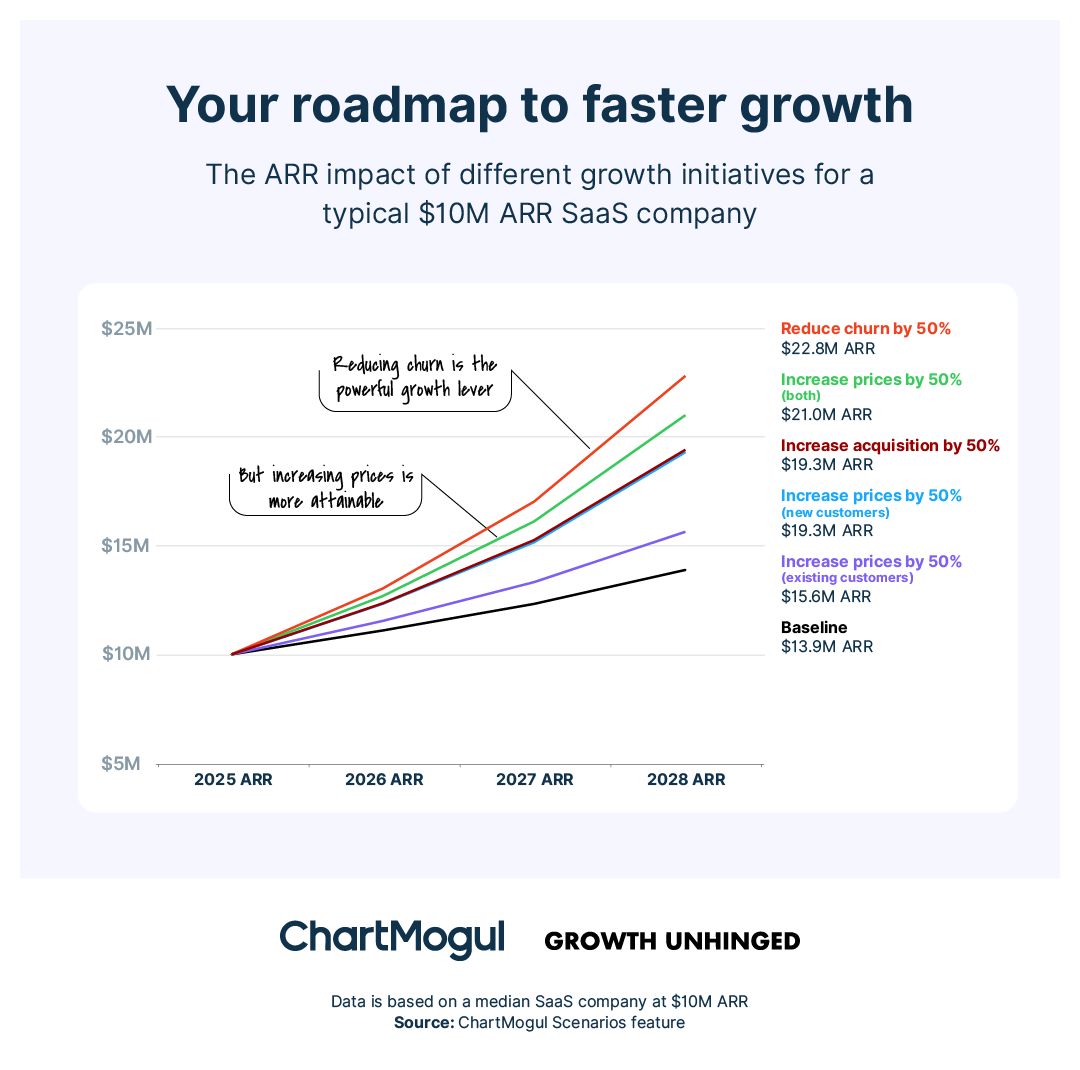
Every SaaS founder asks “what if?” - What if churn improved? - What if we raised prices? - What if we acquired new customers faster? Our latest report, Growth Levers: The Path from $1 to $20M ARR, shows how small improvements can add up to massive ARR gains. Check out the latest insights from ChartMogul's Analyst-in-Residence Kyle Poyar: https://lnkd.in/ecCnRBfv Want to see it for yourself? With ChartMogul Scenarios, you can model each lever: churn, pricing, and growth to see how they shape the future of your SaaS business. 🔗 Try Scenarios free and start modeling your growth → https://lnkd.in

LinkedIn image · Nov 2025 – Mar 2026 Library ↗
ChartMogul image ad

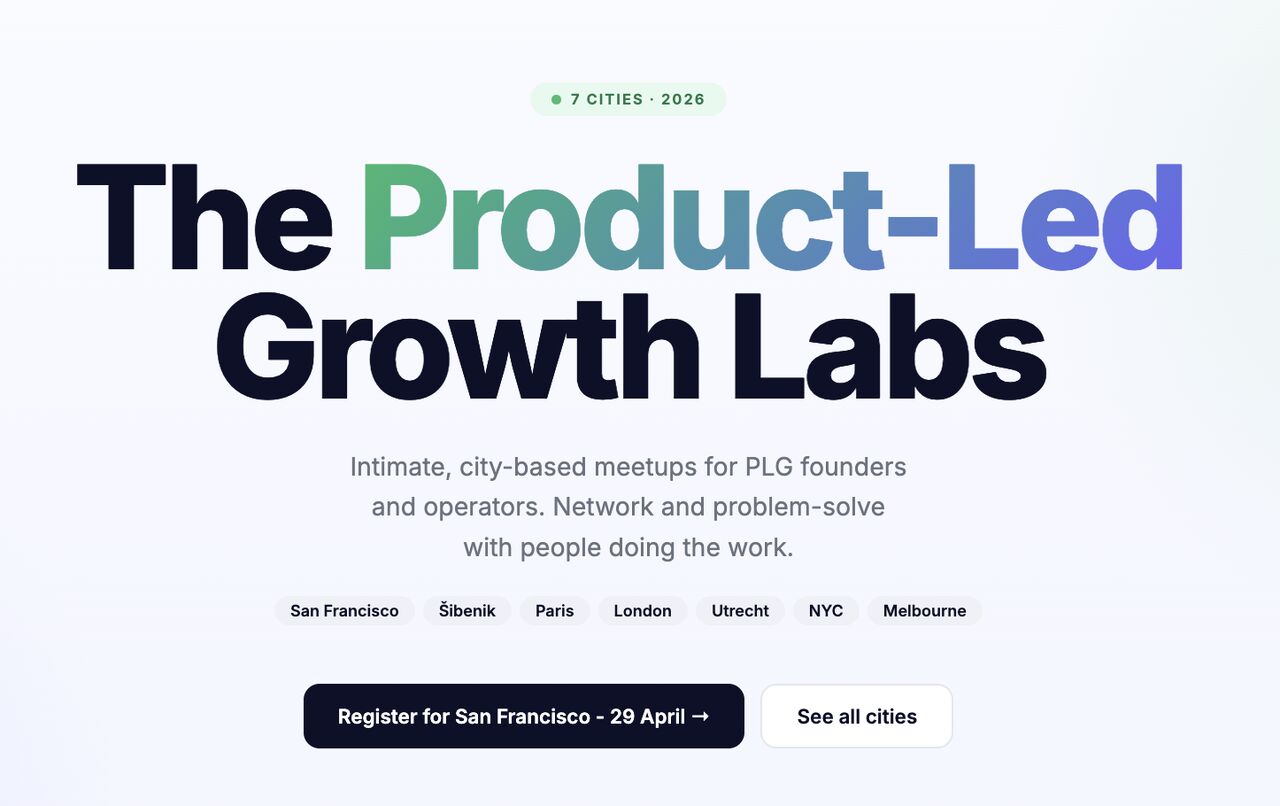
The best event ROI is usually a really good conversation. At this point, a big chunk of my WhatsApp is people I’ve met through ChartMogul: customers, partners, and industry friends. That’s the thinking behind something new we’re launching at ChartMogul this year: The Product-Led Growth Labs. It’s a city-by-city event series for PLG founders and operators who want thoughtful conversation, practical ideas, and time with people who actually understand the work. The idea is simple: smaller rooms, sharper discussions, better conversations. We wanted to create the kind of event where you can meet th

LinkedIn image · Apr – Jul 2026 Library ↗
ChartMogul image ad

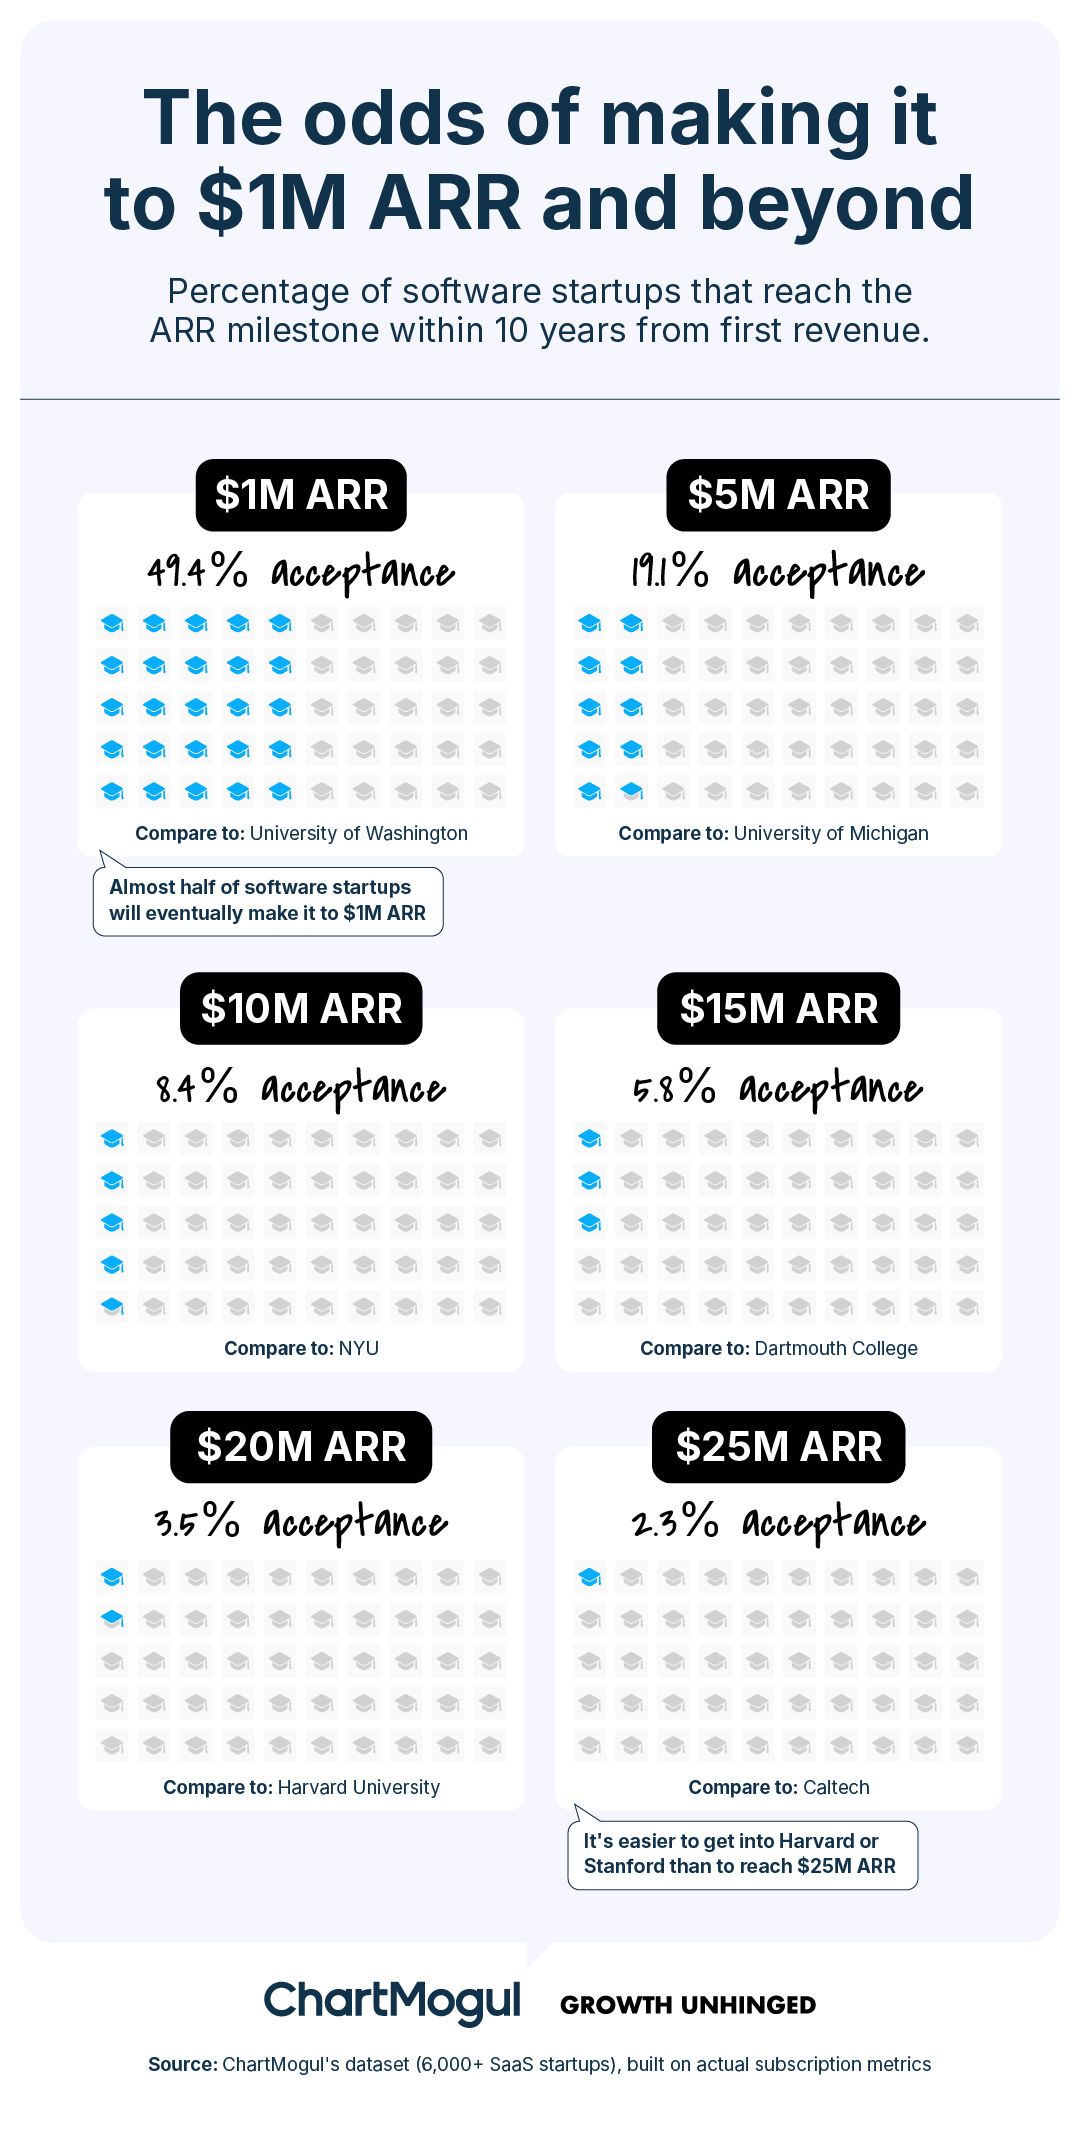
New data from 6,525 SaaS startups: It’s easier to get into Harvard or Stanford than it is to reach $25 million ARR within 10 years. Let that sink in. I'm pumped to announce that I've partnered up with ChartMogul as their Analyst-in-Residence (fancy title, huh?), which means I get to dig into their 🔥 dataset on subscription metrics going back 10+ years & share it with you. What I found: - Almost half of software startups do eventually make it to $1 million ARR after they’ve started monetizing -- if they’re willing to stick around.* - One-in-five make it to $5 million ARR. - One-in-ten make it

LinkedIn image · Oct 2025 – Jan 2026 Library ↗
ChartMogul image ad

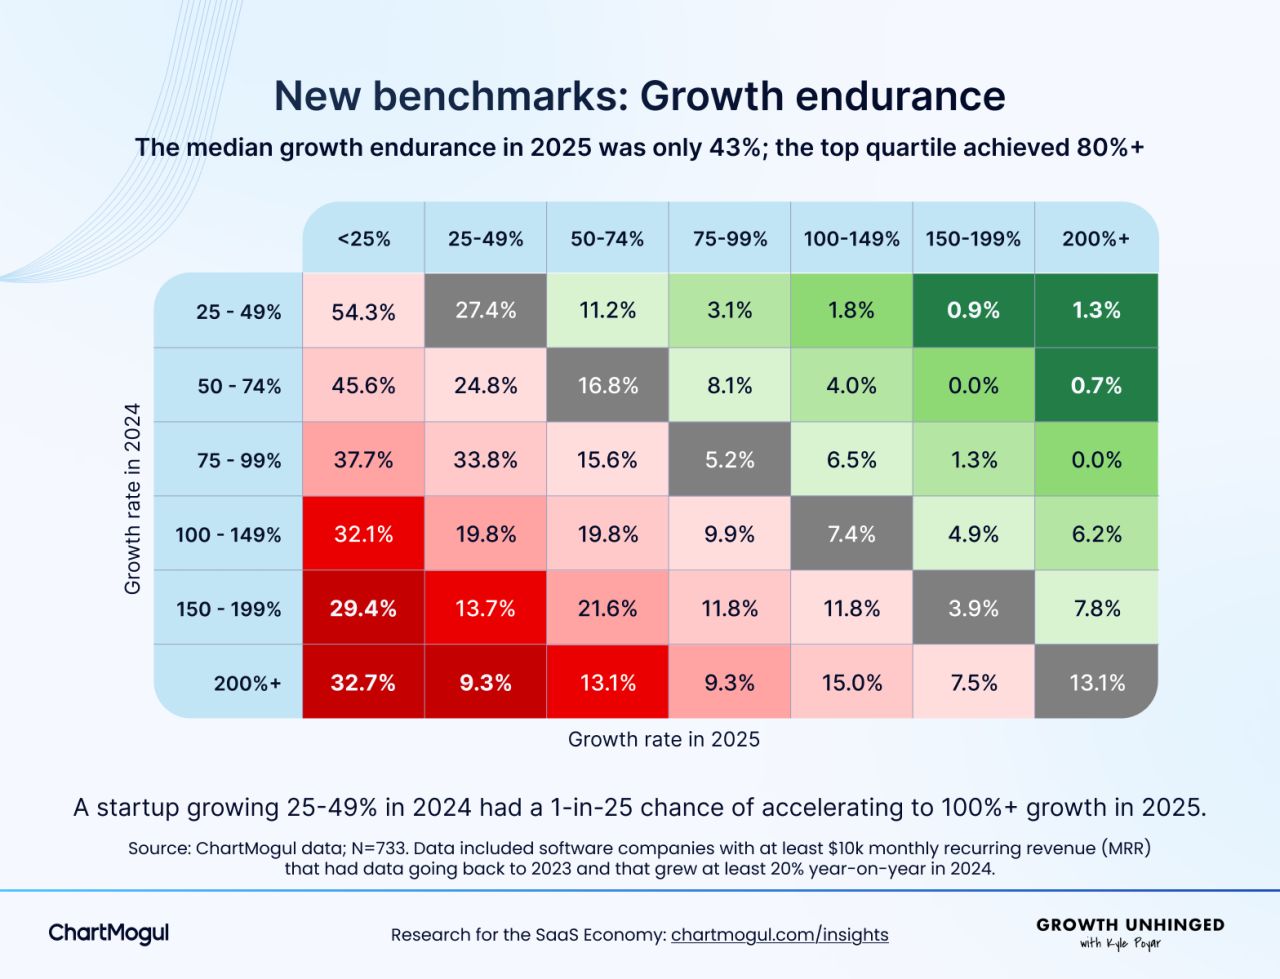
New data: Growth endurance in software is down to only 43%. This is a wake-up call for SaaS 👀 - Fewer than 1-in-5 startups maintained or improved their growth rate from 2024 to 2025. - A startup growing between 25-49% in 2024 had a 1-in-25 chance of accelerating to 100%+ growth in 2025. This data comes from SaaS metrics & growth platform ChartMogul, where I'm an Analyst-in-Residence. We used a dataset of 700+ private software companies that had at least $10k in MRR, had data going back to 2023 or earlier, and that grew at least 20% YoY in 2024. The 2025 growth endurance numbers are a wake-up

LinkedIn image · Apr – Jul 2026 Library ↗

Subscription analytics

LinkedIn 8 ads Apr – Jul 2026

chartmogul.com/subscription-analytics · “The rock-solid revenue foundation beneath every board deck, investor update, and AI-led analysis”

ChartMogul ad: What metric do you need to get right first?
What metric do you need to get right first?

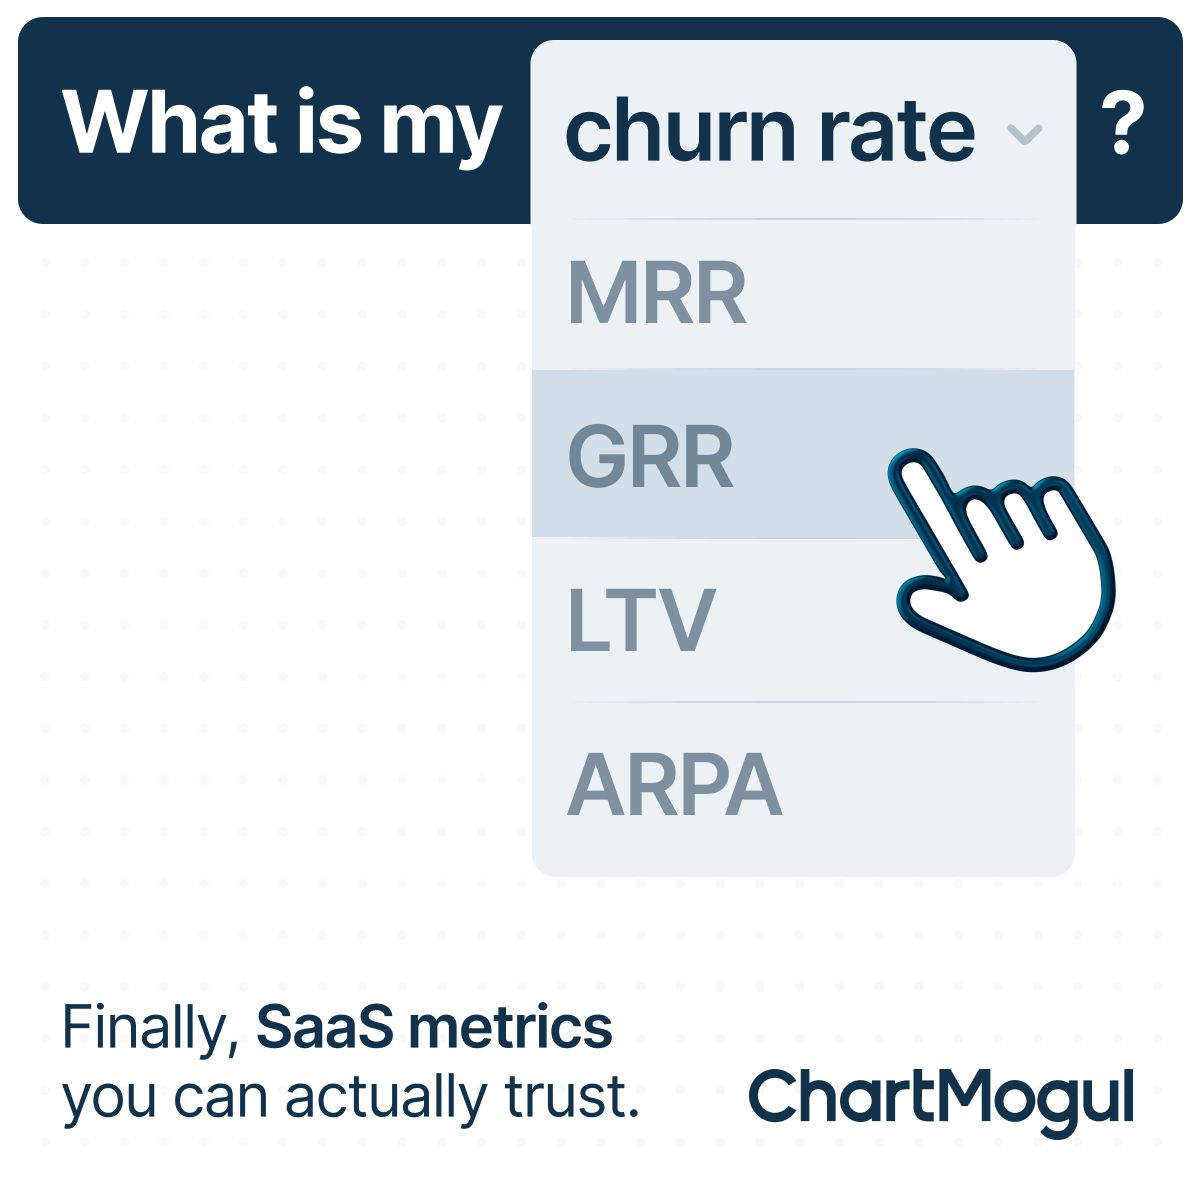
MRR. GRR. LTV. ARPA. Churn rate. You know the acronyms. But do you trust the numbers behind them? Most SaaS teams are working off metrics that are approximate at best. ChartMogul gives you subscription analytics you can actually stake decisions on.

LinkedIn image · Apr – Jul 2026 Library ↗
ChartMogul ad: Try ChartMogul free
Try ChartMogul free

Churn isn't one number. It's different by plan, channel, market, and customer segment. Treating it as a single metric means you're flying blind. ChartMogul lets you slice churn exactly how your business is structured, so you can see what's actually driving it.

LinkedIn image · Apr – Jul 2026 Library ↗
ChartMogul ad: Stitch your ARR
Stitch your ARR

Still stitching together your ARR from CSV exports, spreadsheet formulas, and a prayer? Manual reporting breaks down fast, especially when your subscription data lives in three places and your board meeting is on Friday. ChartMogul connects your billing data and gives you clean, reliable ARR automatically.

LinkedIn image · Apr – Jul 2026 Library ↗
ChartMogul ad: Subscription analytics doesn't have to be a crime scene.
Subscription analytics doesn't have to be a crime scene.

Trial end. Plan change. Upgrade. Seat removal. If understanding your subscription data feels like pinning red string to a corkboard, there's a better way. ChartMogul untangles your subscription events and turns them into metrics that actually make sense, automatically.

Sign Up
LinkedIn image · Apr – Jul 2026 Library ↗

Kitchn

LinkedIn 2 ads Apr – Jul 2026

chartmogul.com/stories/kitchn · “Kitchn runs PLG faster with subscription truth at the center”

ChartMogul ad: See how kitchn got their metrics back under control
See how kitchn got their metrics back under control

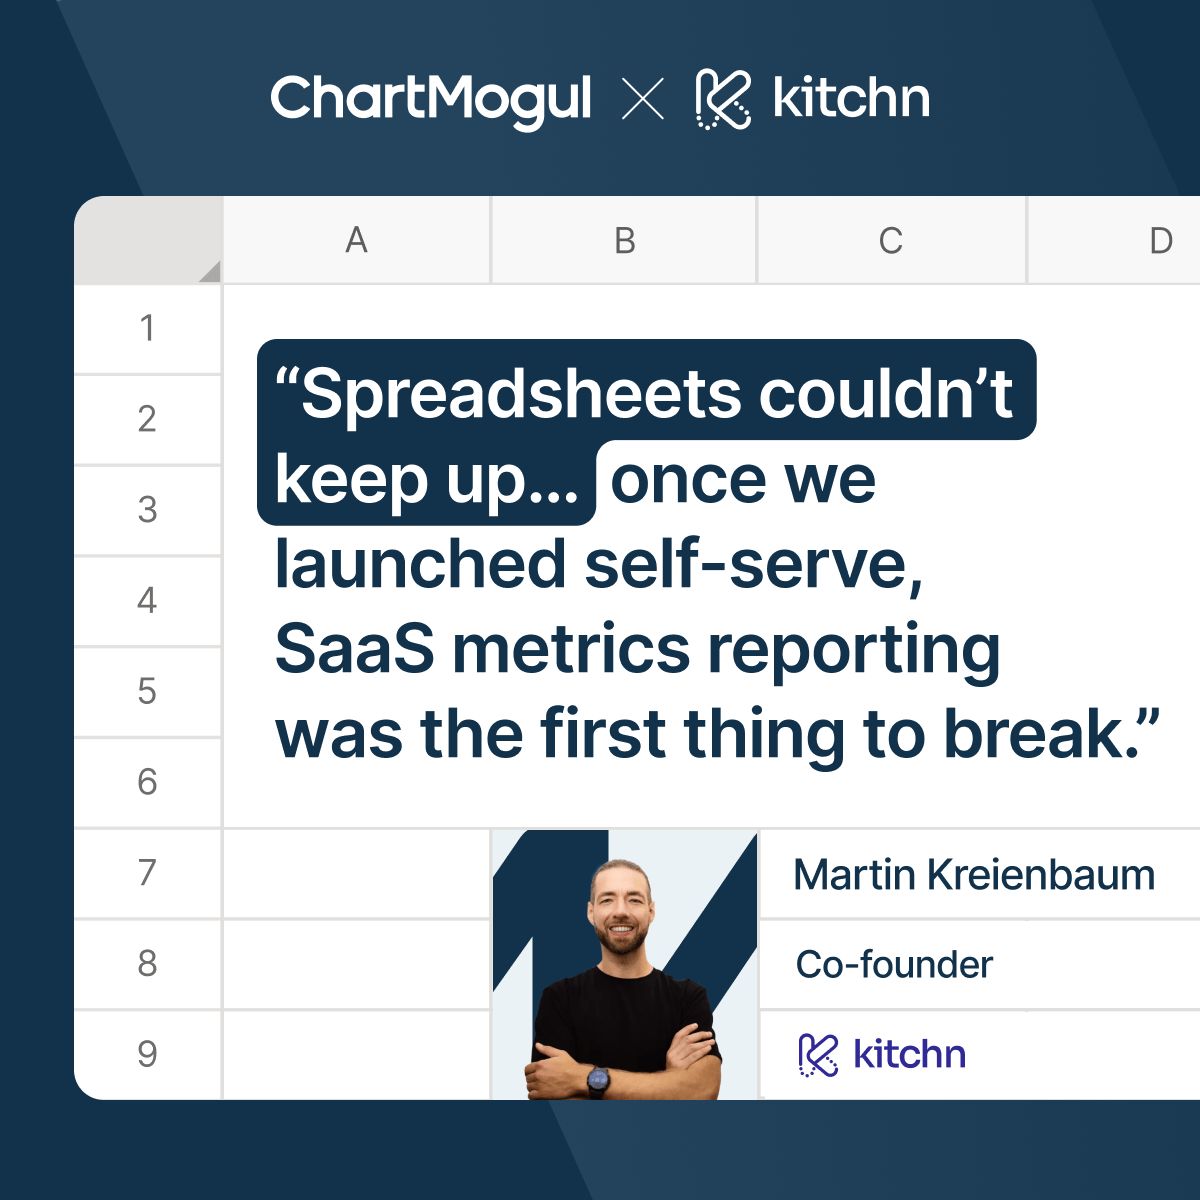
"Spreadsheets couldn't keep up... once we launched self-serve, SaaS metrics reporting was the first thing to break." — Martin Kreienbaum, Co-founder at Kitchn. Sound familiar? When your subscription motion scales, manual reporting doesn't scale with it. ChartMogul does.

LinkedIn image · Apr – Jul 2026 Library ↗